Mortgage prepayment modeling
The central modeling object in mortgage-backed-securities (MBS) pricing is the conditional prepayment rate (CPR): the fraction of outstanding principal that borrowers prepay per unit time. CPR depends on the refinance incentive (borrower’s note rate minus prevailing market rates), borrower characteristics, and the cohort’s refinance history. We walk through the S-curve parameterization, the burnout effect, and the implications for MBS cash-flow modeling. The analysis is drawn from standard fixed-income practice (Fabozzi 2005) and from my own work at Citigroup Global Markets in 2014–2015; all specific numbers and methods here are from the public literature, not from any firm’s proprietary models.
1. Why prepayment matters
A pool of mortgages issued with fixed coupons generates predictable scheduled cash flows, but those cash flows are only the floor. Borrowers can and do prepay, typically by refinancing when market rates drop. Prepayment is the dominant source of uncertainty in MBS cash-flow timing and therefore in MBS pricing, duration, and convexity.
An MBS investor holds short a prepayment option: when rates fall and the option becomes valuable to the borrower, the investor loses the high-coupon cash flow and gets their principal back at par, in a world where they would have preferred to keep the now-above-market coupon.
2. The S-curve
The basic relationship between refinance incentive (in percentage points) and CPR is empirically S-shaped:
where:
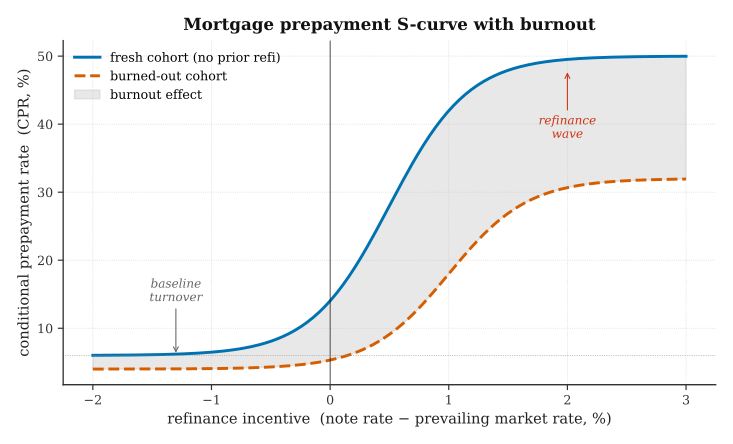
- baseline is typical turnover (non-refinance-driven prepayment from home sales, defaults, etc.), historically 4–8% annualized.
- max_increment is the additional prepayment rate under strong refinance incentive, historically 30–50% annualized.
- is the slope of the S-curve at the inflection point.
- is the inflection point, typically ~0.5–1.0 percentage points of incentive.
3. Burnout
The critical refinement to the basic S-curve is burnout: cohorts that had opportunity to refinance but did not are systematically less responsive to future refinance opportunities. Some refinance-eligible borrowers are less attentive, have worse credit and cannot qualify, or face transaction costs that exceed the benefit.
A standard parameterization tracks the cohort’s refinance history and reduces the effective max_increment proportional to accumulated “refi opportunity not taken”:
where ReSRatio tracks cumulative exposure to below-coupon market rates. The figure shows the shift: the burned-out cohort has a lower asymptote and a rightward-shifted inflection point.
Burnout has large implications for seasoned pools. A 30-year pool that is 10 years old has a very different effective prepayment sensitivity than a freshly-issued pool, even at identical coupons and incentives.
4. Beyond the S-curve
Production prepayment models (PSA, Fannie Mae’s standard, proprietary dealer models) are far more elaborate than the S-curve. They incorporate:
- Seasoning. Prepayment rises in the first 2–3 years after origination before stabilizing.
- Geographic and demographic cohorts. Housing-market conditions affect turnover; borrower income and credit affect refinance friction.
- Media and attention effects. A high-profile rate drop triggers a refinance wave larger than the incentive alone would predict.
- HARP and policy events. The 2012 Home Affordable Refinance Program expansion created measurable distortions in the S-curve for underwater cohorts.
- Servicing transfers and solicitation. Aggressive refinance marketing by servicers can shift cohort behavior measurably.
5. Pricing implication
MBS prices are the discounted sum of projected cash flows, where the cash-flow projection is driven by a prepayment model run through a collection of interest-rate scenarios. The option-adjusted spread (OAS) is the spread to treasuries that prices the MBS, after accounting for the prepayment option:
where the scenarios are Monte Carlo rate paths, are the scenario-specific cash flows determined by the prepayment model, and PV is the present-value operator at the treasury curve plus OAS.
A better prepayment model, one that fits observed CPR histories more closely, produces tighter OAS estimates, which directly matters for relative-value trades between different MBS classes (e.g., 30-year vs. 15-year, conventional vs. Ginnie Mae). This is why MBS shops invest heavily in prepayment modeling.
6. Modern developments
The prepayment-modeling literature since the 2010s has incorporated:
- Machine-learned predictors (random forests, gradient boosting) for CPR that improve on the classical S-curve by exploiting higher-dimensional feature interactions.
- Agent-based models of refinance decisions that capture heterogeneity in borrower attention and cost.
- Explicit risk/return frameworks for non-linear sensitivity: effective duration, effective convexity, and higher-moment sensitivities computed via full-model simulation rather than closed-form.
7. References
- Fabozzi, F. J. (2005). The handbook of mortgage-backed securities. 6th ed., McGraw-Hill.
- Schwartz, E. S., & Torous, W. N. (1989). Prepayment and the valuation of mortgage-backed securities. Journal of Finance, 44(2), 375–392.
- Richard, S. F., & Roll, R. (1989). Prepayments on fixed-rate mortgage-backed securities. Journal of Portfolio Management, 15(3), 73–82.
- Stanton, R. (1995). Rational prepayment and the valuation of mortgage-backed securities. Review of Financial Studies, 8(3), 677–708.
- Deng, Y., Quigley, J. M., & Van Order, R. (2000). Mortgage terminations, heterogeneity and the exercise of mortgage options. Econometrica, 68(2), 275–307.